A buried granite giant is reshaping how scientists model West Antarctic ice
From orbit, Antarctica reads as a pristine white expanse. Beneath the surface, however, the continent hides the gritty mechanics that govern ice flow. A newly mapped, nearly 100‑kilometer‑wide and roughly seven‑kilometer‑thick granite body sitting under the fast‑changing Pine Island Glacier helps explain both a decades‑old mystery of pink boulders in the Hudson Mountains and why this outlet glacier behaves the way it does.
Aircraft carrying gravity sensors traced a distinct subsurface signal that matches a massive, dense rock formation—large enough to influence how the overlying ice slides, sticks, and channels meltwater. That geophysical map links directly to physical samples: pink granite erratics perched on nearby volcanic terrain and Jurassic‑age mineral crystals dated to about 175 million years.
“It’s remarkable that pink granite boulders spotted on the surface have led us to a hidden giant beneath the ice,” said Dr. Tom Jordan, lead author and geophysicist at BAS.
“By combining geological dating with gravity surveys, we’ve not only solved a mystery about where these rocks came from, but also uncovered new information about how the ice sheet flowed in the past and how it might change in the future.”
The tech stack that turned scattered boulders into a subsurface map
What began as a geological puzzle has become a high‑resolution map of one of West Antarctica’s most critical glacier beds. The discovery reflects a modern polar‑science workflow that fuses field geology with remote sensing and high‑performance computing. Each layer constrains another until a coherent picture of the bed emerges that climate and sea‑level modelers can actually use.
- Airborne gravimetry: wing‑mounted instruments detect tiny variations in Earth’s gravity field caused by denser or lighter rocks beneath the ice.
- Ice‑penetrating radar and altimetry: radar profiles and surface elevation help separate bed geometry from density contrasts.
- Precision navigation: differential GNSS and inertial systems correct aircraft motion so gravity signals remain interpretable.
- Geochronology: radioactive decay measurements inside mineral grains set the Jurassic age of the granite, tying erratics to their source.
- Inverse modeling on HPC: algorithms convert gravity anomalies into plausible 3D rock bodies consistent with radar and geological constraints.
The result is not a single picture but a set of mutually consistent datasets that can be ingested by continental‑scale ice models and updated as new observations come in.
Bedrock composition is a control knob for glacier speed
Once the subsurface map is in hand, its relevance to ice behavior becomes clear. Ice dynamics hinge on what lies beneath. Granite’s hardness and roughness can raise basal friction and pin ice in place; fractured zones and water‑filled pathways can do the opposite, accelerating flow along lubricated corridors. The newly mapped block helps explain why this outlet responds rapidly to small ocean or atmospheric nudges and why thinning can propagate inland along specific corridors.
- Higher friction patches can temporarily buttress fast ice streams.
- Basal water routing along bedrock contacts can localize sliding.
- Sediment‑poor, crystalline rock yields different till and hydrology than soft marine sediments.
For West Antarctica, where parts of the ice sheet rest on bedrock below sea level, those friction contrasts feed directly into assessments of how quickly grounded ice might retreat under continued warming.
From science to risk: who depends on better Antarctic bed maps
That link between hidden rock and ice behavior is no longer abstract: it sets boundary conditions for sea‑level projections used across critical sectors. Governments, regulators, and boardrooms are increasingly being asked to show how they price climate risk; Pine Island Glacier’s granite underlay is now part of that backstory.
- Coastal planners and port authorities: design elevations, quay upgrades, and dredging strategies depend on updated sea‑level curves that incorporate West Antarctic contributions.
- Insurers and reinsurers: catastrophe models integrate Antarctic mass‑loss scenarios to price coastal risk, reinsurance capacity, and solvency buffers.
- Power, water, and wastewater utilities: substation siting, pump‑station floodproofing, and intake protection assume decadal sea‑level increments grounded in the latest ice‑sheet science.
- Emergency management agencies: evacuation thresholds, zoning decisions, and flood mapping align to scenario ranges sensitive to West Antarctic dynamics.
- Polar logistics and national programs: ice‑shelf stability influences field routes, resupply windows, aviation safety margins, and asset‑protection plans for research stations.
For many of these actors, more defensible Antarctic bed maps translate into narrower uncertainty bands in the regulatory filings, resilience plans, and capital programs they must justify to oversight bodies and the public.
Regulatory guardrails for a continent rich in data, not extractives
The presence of a large granite body can invite speculation about mineral potential. Antarctic law forecloses that path and channels activity toward science and environmental protection. Under the Antarctic Treaty System, the continent is governed by a set of agreements that prioritize peaceful use and research over commercial exploitation.
| Milestone | Scope | Implication for this discovery |
|---|---|---|
| 1959: Antarctic Treaty | Demilitarizes the continent; promotes scientific cooperation and data exchange. | Enables multinational airborne surveys and open research campaigns that make such mapping possible. |
| 1991: Protocol on Environmental Protection (Madrid Protocol) | Designates Antarctica a natural reserve; establishes strict environmental impact assessment. | Airborne geophysics and field sampling proceed under environmental safeguards and permitting rules. |
| 1998: Protocol enters into force | Prohibits mineral resource activities other than scientific research. | Precludes commercial extraction; scientific mapping remains the permitted and primary use of such geological insights. |
| Post‑2048: Potential Protocol review | Parties may consider changes under defined procedures. | The current mining ban continues unless parties agree otherwise, keeping discoveries like this firmly in the realm of science and climate‑risk assessment. |
Data integrity, calibration, and open pipelines
Turning a gravity anomaly into a policy‑relevant dataset depends on trust in the underlying measurements. Earth‑observation programs rely on defensible data lineage. For polar campaigns, that means rigorous instrument calibration, redundant navigation, and openly archived flight lines and inversions so independent teams can replicate results.
- Calibration and drift control: repeated tie‑lines and reference passes reduce instrument bias and make long campaigns comparable.
- Versioned datasets: public repositories track processing updates and preserve earlier releases for audit and re‑analysis.
- Cross‑sensor checks: gravity interpretations are reconciled with radar‑derived bed picks and surface velocity mosaics.
- Provenance and metadata: standardized formats make downstream modeling auditable by national climate‑assessment bodies and research councils.
This emphasis on open pipelines means the granite map is not a black box: regulators, modelers, and independent scientists can trace how each data product was built.
How the new map tightens sea‑level projections
Ice‑sheet models perform best when basal conditions are realistic. The granite body gives modelers a firmer grip on where the glacier can anchor and where it will slip, especially in a sector already primed for marine ice‑sheet instability and closely watched in national climate‑risk reports.
- Updated basal friction fields: crystalline bed units inform spatially varying slip laws and grounding‑line behavior.
- Hydrology parameterization: rock contacts and topographic lows constrain water routing beneath the ice.
- Sensitivity tests: ensembles explore how ocean‑driven melt interacts with new bed constraints to accelerate or slow retreat.
- Risk translation: results feed coastal flood curves used in infrastructure design standards, prudential supervision, and financial stress testing.
The peer‑reviewed study converts that physical reality into data products fit for models that guide policy, regulatory disclosure frameworks, and capital planning horizons measured in decades rather than years.
From field clues to continental narrative
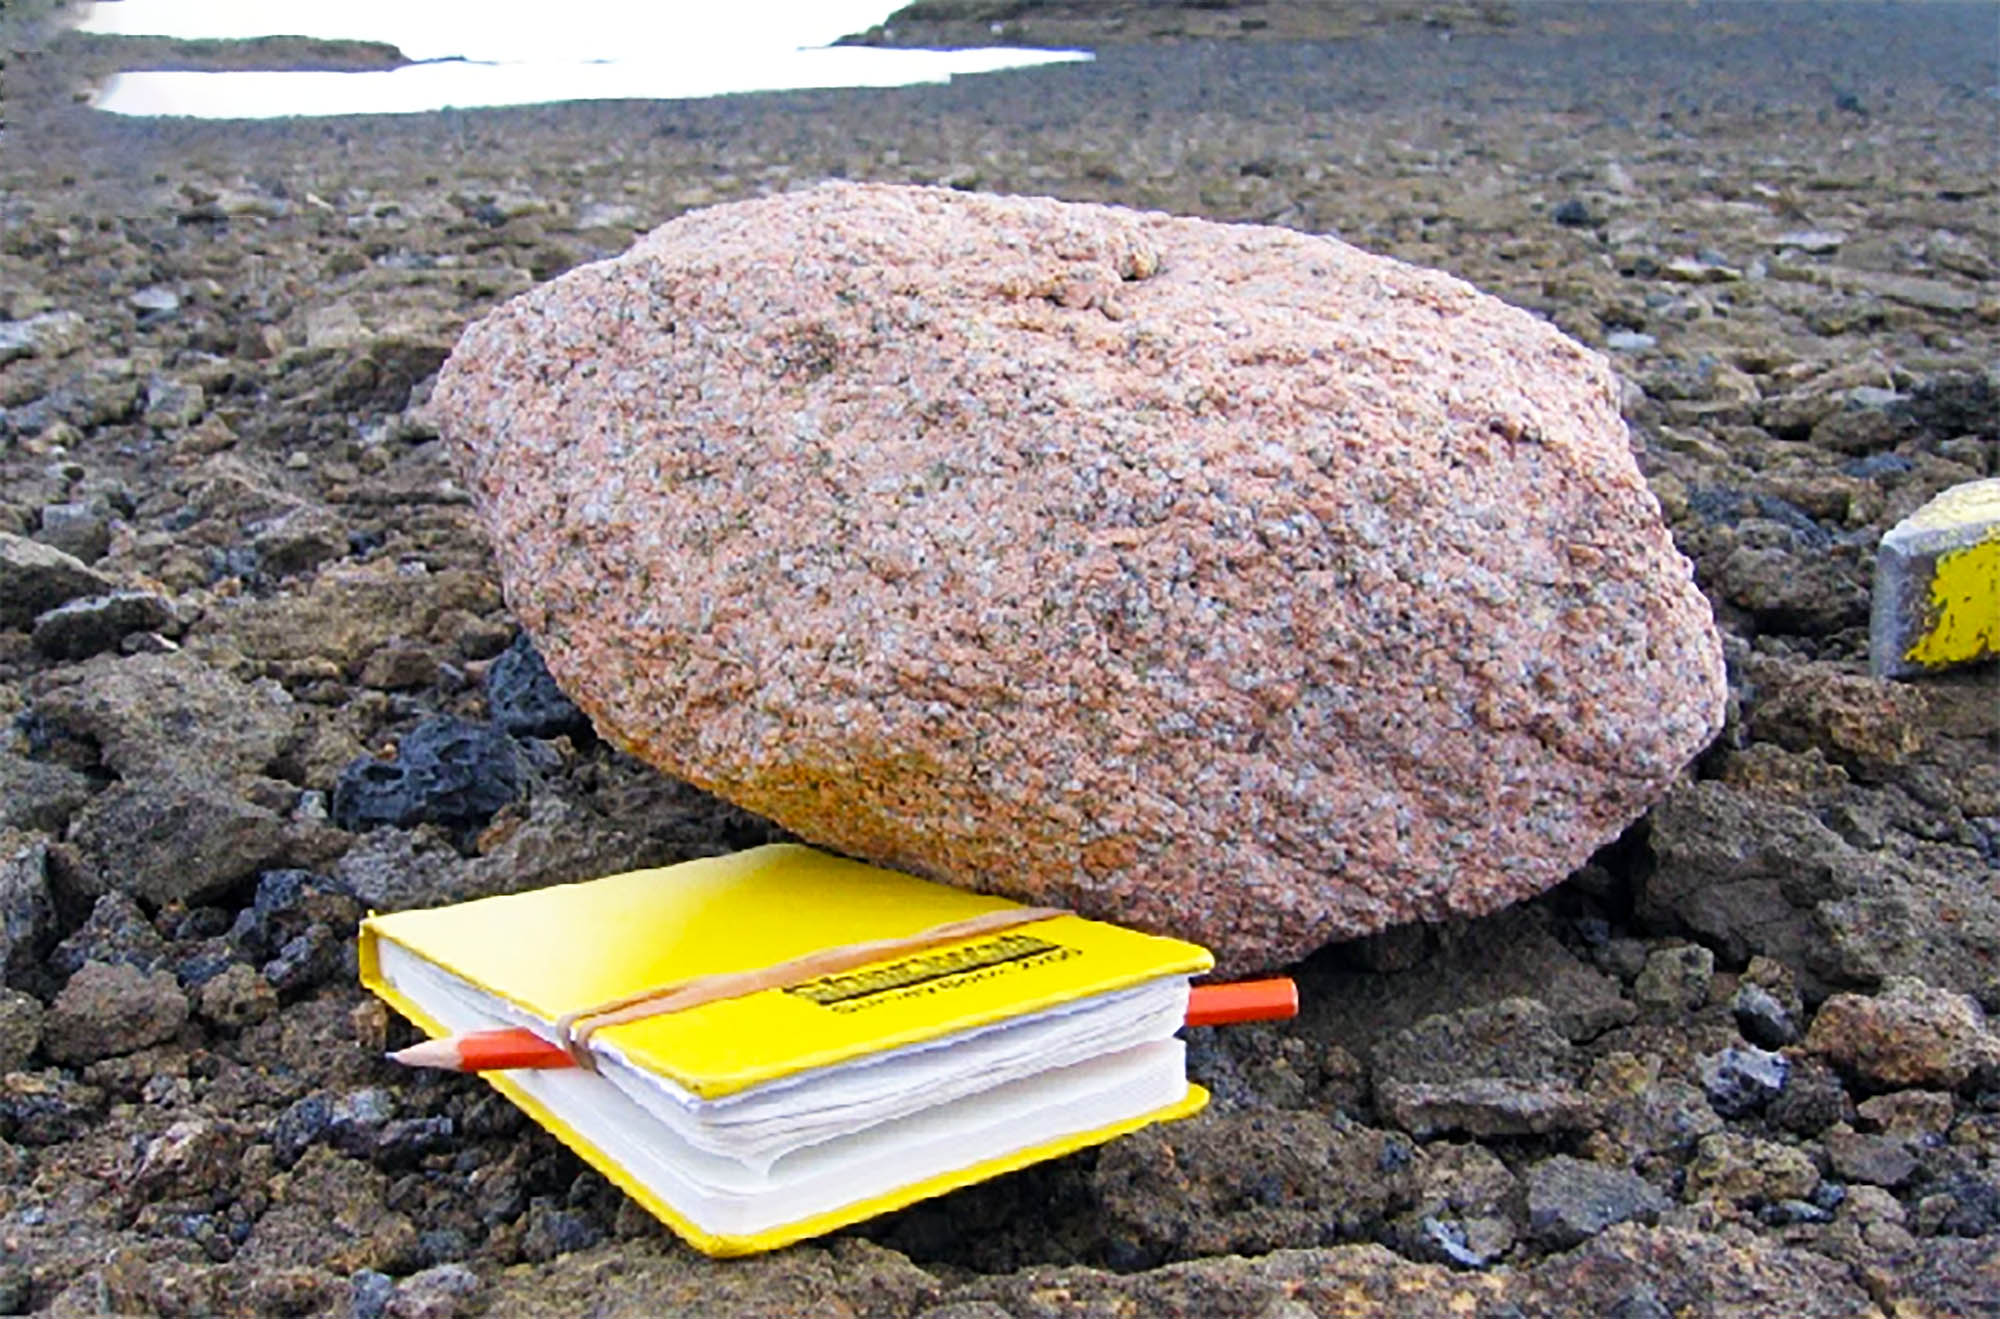
The scientific arc started with fieldwork in the Hudson Mountains, where pink granite boulders sat improbably among dark volcanic rocks. Those erratics, along with an outcrop at Sif Island, pointed to a source deep under the modern ice stream and motivated the targeted airborne surveys.
“Rocks provide an amazing record of how our planet has changed over time, especially how ice has eroded and altered the landscape of Antarctica,” she said. “Boulders like these are a treasure trove of information about what lies deep beneath the ice sheet, far out of reach.”
“By identifying their source, we have been able to piece together how they got to where they are today, giving us clues about how the West Antarctic Ice Sheet may change in future – information that is vital for determining the impact of sea level rise on coastal populations around the world.”
In practical terms, that journey from an isolated boulder to a continent‑scale map shows how modern geophysics, open data, and targeted field science can sharpen the tools governments, markets, and communities use to prepare for rising seas—long before the consequences reach their shorelines.